Compositional Modeling with Decorated Cospans
Posted by John Baez
.")
It’s finally here: software that uses category theory to let you build models of dynamical systems! We’re going to train epidemiologists to use this to model the spread of disease. My first talk on this will be on Wednesday June 29th. You’re invited!
• Compositional modeling with decorated cospans, Graph Transformation Theory and Practice (GReTA) seminar, 19:00 UTC, Wednesday 29 June 2022.
You can attend live on Zoom if you click here. You can also watch it live on YouTube, or later recorded, here.
Abstract. Decorated cospans are a general framework for composing open networks and mapping them to dynamical systems. We explain this framework and illustrate it with the example of stock and flow diagrams. These diagrams are widely used in epidemiology to model the dynamics of populations. Although tools already exist for building these diagrams and simulating the systems they describe, we have created a new software package called StockFlow which uses decorated cospans to overcome some limitations of existing software. Our approach cleanly separates the syntax of stock and flow diagrams from the semantics they can be assigned. We have implemented a semantics where stock and flow diagrams are mapped to ordinary differential equations, although others are possible. We illustrate this with code in StockFlow that implements a simplified version of a COVID-19 model used in Canada. This is joint work with Xiaoyan Li, Sophie Libkind, Nathaniel Osgood and Evan Patterson.
My talk is at a seminar on graph rewriting, so I’ll explain how the math applies to graphs before turning to ‘stock-flow diagrams’, like this one here:
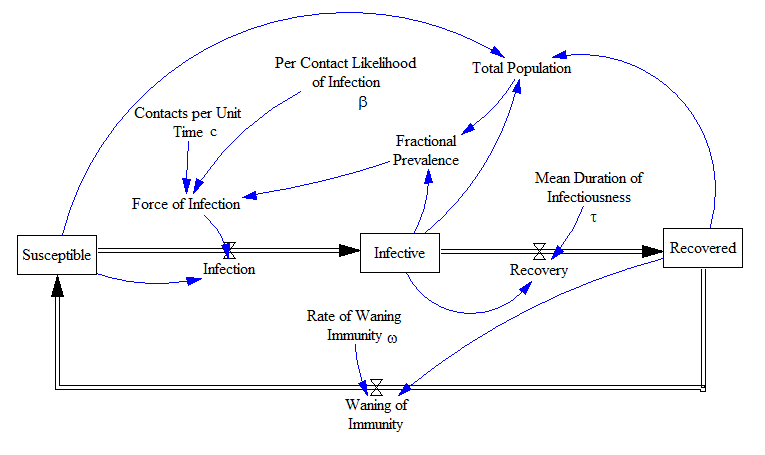
Stock-flow diagrams are used to create models in epidemiology. There’s a functor mapping them to dynamical systems.
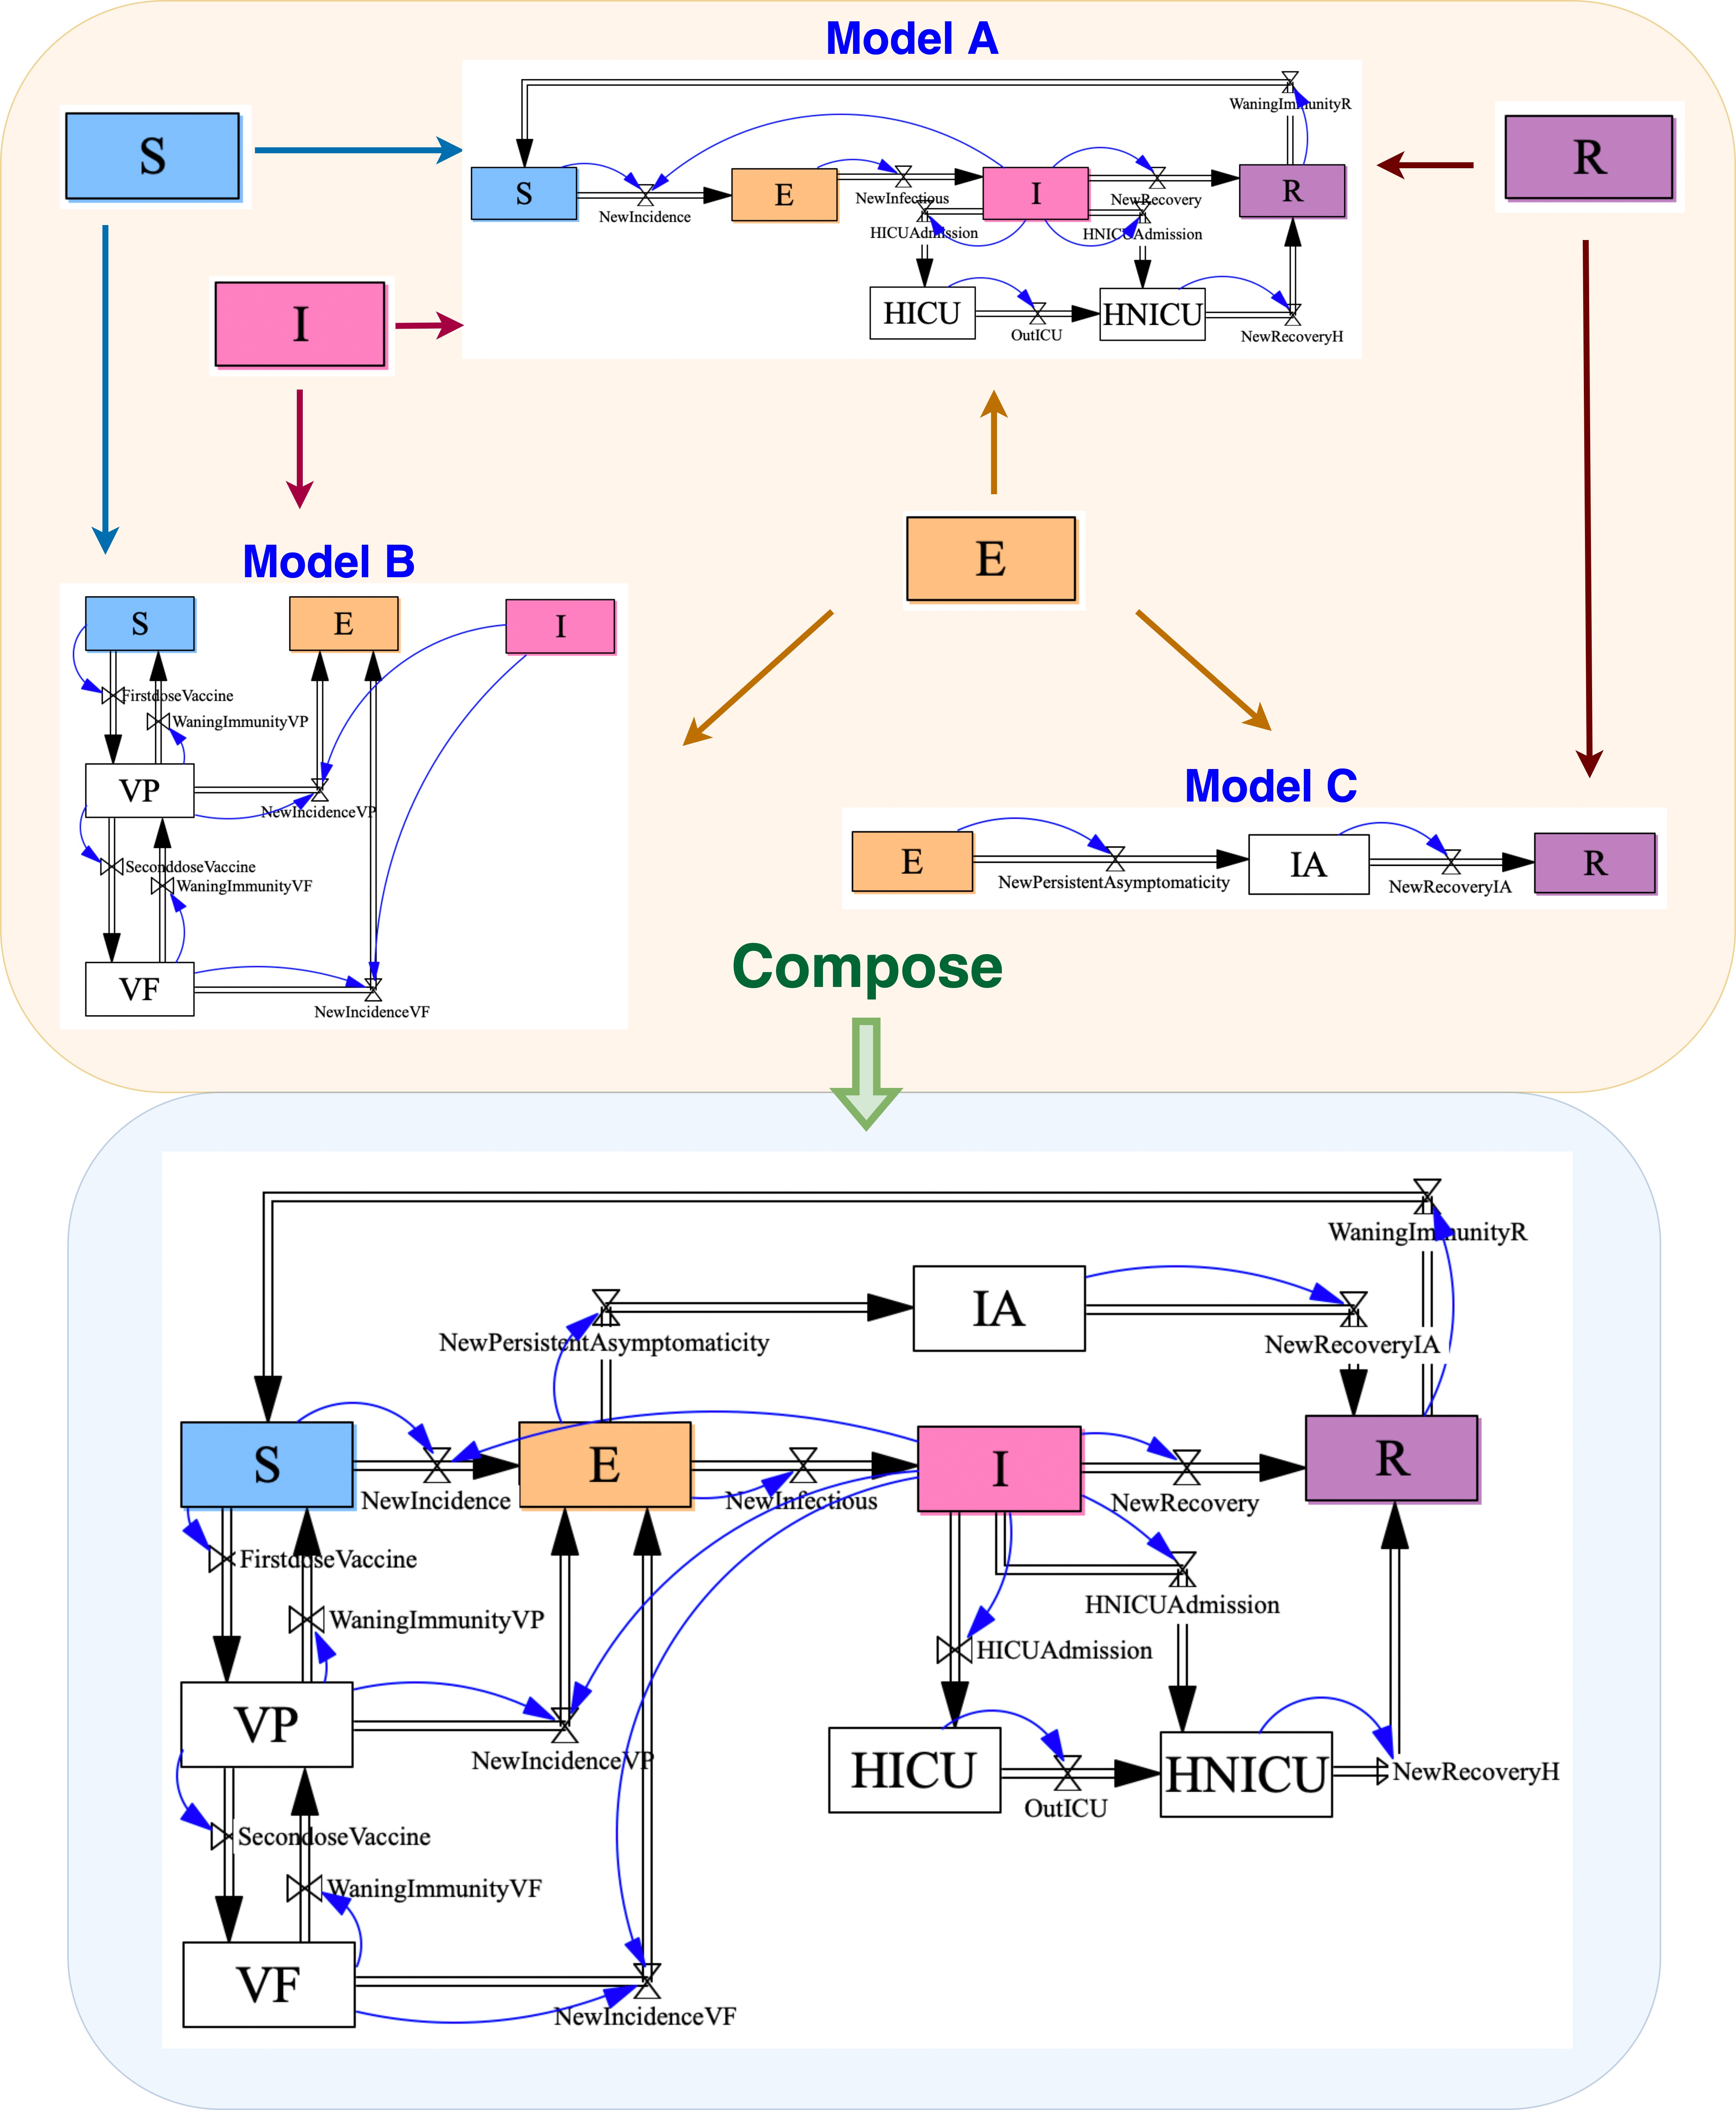
But the key idea in our work is ‘compositional modeling’. This lets different teams build different models and then later assemble them into a larger model. The most popular existing software for stock-flow diagrams does not allow this. Category theory to the rescue!
This work would be impossible without the right team! Brendan Fong developed decorated cospans and then started the Topos Institute. My coauthors Evan Patterson and Sophie Libkind work there, and they know how to program using category theory.
Evan started a seminar on epidemiological modeling - and my old grad school pal Nate Osgood showed up, along with his grad student Xiaoyan Li! Nate is a computer scientist who now runs the main COVID model for the government of Canada.
So, all together we have serious expertise in category theory, computer science, and epidemiology. Any two parts alone would not be enough for this project.
And I’m not even listing all the people whose work was essential. For example, Kenny Courser and Christina Vasilakopoulou helped modernize the theory of decorated cospans in a way we need here. James Fairbanks, Evan and others set up AlgebraicJulia, the software environment that our package StockFlow relies on. And so on!
Moral: to apply category theory to real-world problems, you need a team.
And we’re just getting started!