Skip to the Main Content

Note:These pages make extensive use of the latest XHTML and CSS Standards. They ought to look great in any standards-compliant modern browser. Unfortunately, they will probably look horrible in older browsers, like Netscape 4.x and IE 4.x. Moreover, many posts use MathML, which is, currently only supported in Mozilla. My best suggestion (and you will thank me when surfing an ever-increasing number of sites on the web which have been crafted to use the new standards) is to upgrade to the latest version of your browser. If that's not possible, consider moving to the Standards-compliant and open-source Mozilla browser.

December 19, 2017

SageMath and 3D Models in Webpages

Posted by Simon Willerton

I want to write a few posts (which means at least one!) on things I’ve done around SageMath, not necessarily about SageMath, but using that as a springboard. Here I’ll say how I used it to help visualization – for both the students and me! – in the differential geometry course I’ve been teaching this semester.

SageMath (formerly SAGE) is a computer algebra system like Mathematica, Maple and MATLAB. However, unlike those other systems, it doesn’t start with an ‘M’. More importantly though, it is an open source project which, amongst other things, provides a unified ‘front-end’ for many other pieces of open source mathematical software such as Maxima, PARI and GAP. Having been using Maple since I was a PhD student, I started to make the switch to SageMath a couple of years ago, which was not that easy as the biggest problem with SageMath is the lack of introductory material and documentation, although this is now definitely improving, see for instance the book Mathematical Computation with SageMath, originally available in French.

Now onto visualization, here is a static picture of a catenoid surface.

catenoid_static.png

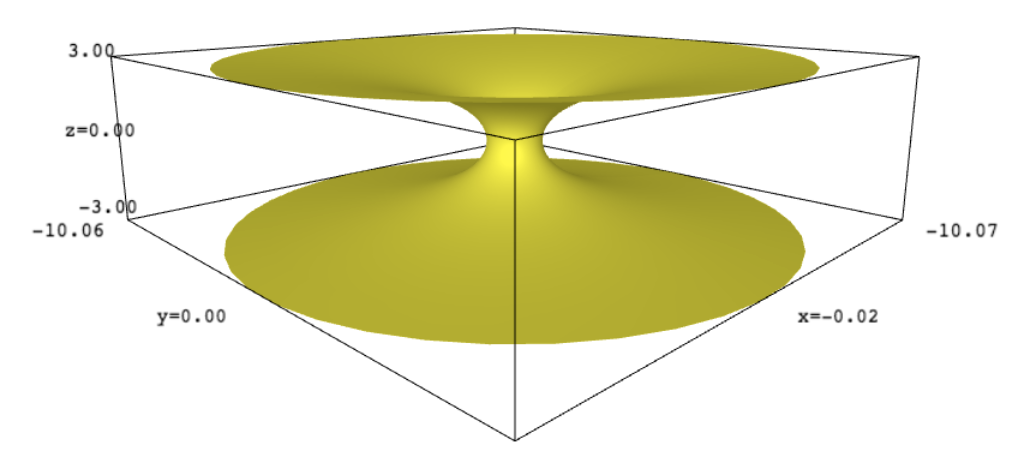
Beneath the fold I’ll explain two ways in which you can use SageMath to embed a rotatable model of the surface in a webpage. All being well, in the main body of the post you should be able to play with the catenoid yourself.

This is, in some sense, a follow-on from one of the first posts I wrote here on using blender for creating 3d models of surface diagrams, nearly eight years ago.

I want to mention two ways to get 3d models into web pages using SageMath. One is by actually including some SageMath on the page which the user can even alter and the other is by including the output of SageMath that you need to alter a little. I won’t go into too much ‘how-to’ detail. I can answer any questions of that nature in the comments.

Using SageCell

SageMathCell is a wonderful thing that allows you to have SageMath running inside a webpage; well, actually it runs on a server in the Mathematics Department at the Universidad Autónoma de Madrid, but the output is displayed on your webpage. It’s very easy to set-up and just requires you to cut and paste some javacript into your webpage’s html. Unfortunately, the anti-hacking security measures here at the Café mean that I can’t do it on this webpage but I can send you over to my page where you can try it yourself.

Plotting surfaces in SageMath

Click on any of the evaluate buttons to get the surface and then you can use your mouse/trackpad/whatever to move the surface around. I would recommend going down the catenoid or helicoid for something a bit more interesting.

You can then edit the SageMath and hit ‘Evaluate’ again to change the surface. Change the ‘cosh’ in the catenoid to a ‘cos’ and see what happens!

This approach allows the students some freedom to experiment with the SageMath code, if they like, without having to actual learn SageMath or to install on their own machines or to register for the cloud version of SageMath, CoCalc (formerly SageMathCloud). If they like what they see then they can move in that direction.

Exporting to html from a Jupyter notebook

An alternative approach is to generate the 3d graphics yourself and then just include the output in the webpage. The way I’ve done this is to use ‘Download as HTML’ in a Jupyter notebook. If you then look in the .html file you’ll see a another .html file inside which encodes the 3d model. You can extract this and either copy the code to your own html or include it as an iframe or object. I can give more details if anyone wants them, or maybe someone can suggest a more efficient workflow.

Anyway, here’s the kind of result you can get. You should be able to move it around with your mouse!

Your browser will not allow the embedded object!

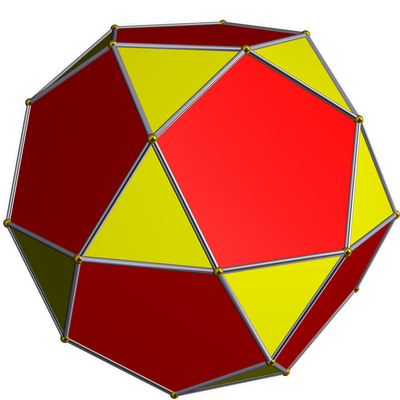
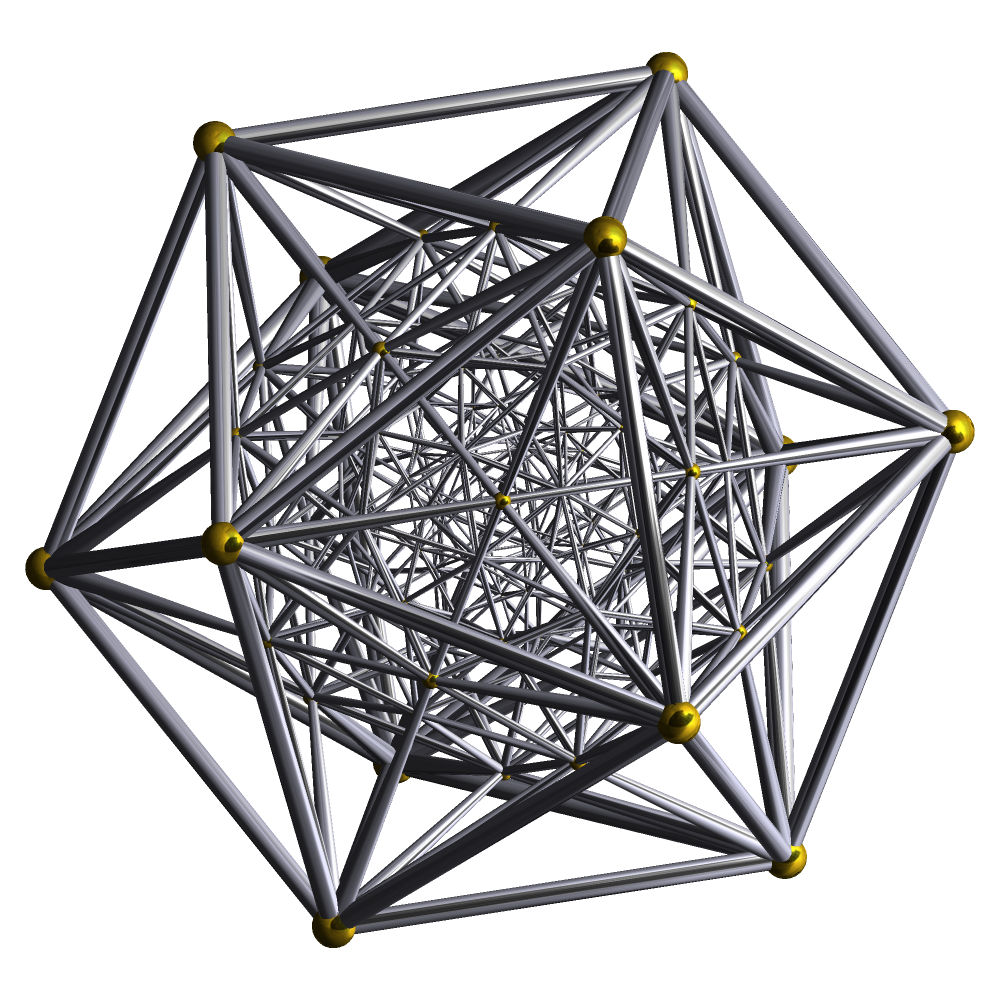
I will just finish with the following little treat for John.

The 600 cell

Posted at December 19, 2017 12:29 PM UTC

TrackBack URL for this Entry:   https://golem.ph.utexas.edu/cgi-bin/MT-3.0/dxy-tb.fcgi/3002

5 Comments & 0 Trackbacks

Re: SageMath and 3D Models in Webpages

You should have explicitly mentioned that your last graphic is dynamic and people should drag their mouse cursor over it. That this might happen does not seem a possibility unless one has gone off to play with the earlier examples. From inspection this is achieved with an <object> that includes a separate .html file.

Posted by: RodMcGuire on December 19, 2017 7:01 PM | Permalink | Reply to this

Re: SageMath and 3D Models in Webpages

Thanks, Simon — that’s nice!

Is this 600-cell orthogonally projected from 4d space down to the plane? No fancy perspective tricks?

If so, I’m surprised and enlightened: I hadn’t imagined that the 600-cell could have shadows that were so far from round!

Just in case anyone lurking here likes to create beautiful animated gifs, here’s one I’d really like to see. I’d like to see a looped animated gif of the 3d polyhedra formed as as ‘slices’ of a 600-cell as a hyperplane passes through it.

In more detail:

We can take the 600-cell to have vertices

(±12,±12,±12,±12)\displaystyle{ (\pm \textstyle{\frac{1}{2}}, \pm \textstyle{\frac{1}{2}},\pm \textstyle{\frac{1}{2}},\pm \textstyle{\frac{1}{2}}) }

(±1,0,0,0)\displaystyle{ (\pm 1, 0, 0, 0) }

12(±Φ,±1,±1/Φ,0)\displaystyle{ \textstyle{\frac{1}{2}} (\pm \Phi, \pm 1 , \pm 1/\Phi, 0 )}

and those obtained from these by even permutations of the coordinates, where

Φ=5+12.\displaystyle{ \Phi = \frac{\sqrt{5} + 1}{2}}.

A nice choice of hyperplanes to slice this with are those where the first coordinate takes a chosen value t[1,1]t \in [-1,1]. As tt goes from 1-1 up to 11, the polyhedron we get will morph from a point to a dodecahedron to an icosahedron to a dodecahedron to — at its largest — an icosidodecahedron:

and then back down to a dodecahedron, an icosahedron, a dodecahedron and finally a point again. So, this will make for a nice looped gif.

For more details see:

The 600-cell, Azimuth, December 16, 2017.

From this you can easily read off the values of tt at which the slices I mentioned occur.

Posted by: John Baez on December 20, 2017 9:20 PM | Permalink | Reply to this

Re: SageMath and 3D Models in Webpages

Ah. I was confused. Now I am less confused. I had assumed that SageMath just produced a model of the picture that you used by the 600-cell, namely this one.

The 600-cell

However that was not the case. Your picture is inscribed in an icosahedron, whereas my model was not. SageMath is drawing a Schlegel diagram of the 600-cell, which means projecting it onto one of its facets in some way. A facet ought to be a tetrahedron in this case.

I don’t quite understand how this projection works, however, by trial and error I have added a ‘projection direction’ which results in a projection to the icosahedron, so it now looks like the projection pictured above.

I have now put both Schlegel projections side-by-side at the page The 600-Cell.

Posted by: Simon Willerton on December 21, 2017 2:25 PM | Permalink | Reply to this

Re: SageMath and 3D Models in Webpages

Since this posts asks if “someone can suggest a more efficient workflow”, the 3D viewer used here now has the option to “Save as HTML” for embedding graphics in web pages. It is also the default 3D viewer for the current version (9.0) of SageMath.

Posted by: Paul Masson on January 16, 2020 1:10 AM | Permalink | Reply to this

Bruce

Great stuff, thanks for sharing this.

Three.js is a brilliant graphics library. Javascript is super fast in modern web browsers. A satisfying thing to do would be to take your models you made in Blender, save them in a suitable 3d file format, and then load that file into three.js. You will have super-reactive embeddable 3d swallowtail diagrams in your webpage!

The best tutorial I found for playing with three.js and doing the above is this one.

Posted by: Bruce Bartlett on February 4, 2020 7:53 PM | Permalink | Reply to this

Post a New Comment